Architecture for AI Systems
A Practical Report from the Financial Sector by Mahbouba Gharbi and Dimitri Blatner
With the rise of data-driven models, AI components have long become an integral part of productive IT systems. But how should we approach systems architecturally when they make autonomous decisions? A customer project focused on the analysis and forecasting of financial data reveals the challenges involved – and the solutions that proved successful.
Initial Situation and Objectives
In this project, we developed software for the automated evaluation of financial data. The goal was a system that analyzes historical and current market data, detects patterns, and generates forecasts – for example, the probability of a price increase of more than five percent. To achieve this, we designed a time series model that included a data strategy, feature engineering, and model architecture. For classification tasks, additional models were used, especially in the case of imbalanced class distributions.
Integration into the existing IT landscape was a key challenge: the model had to be powerful, scalable, and explainable. Although it delivered accurate predictions, the decision-making process was initially hard to understand for the business departments – traceability was essential.
Transparency Through Traceability and Monitoring
One of the main goals was to make the model’s decision-making transparent. A reporting tool illustrated which features were primarily responsible for a prediction. The focus was on identifying relevant influencing factors, quantifying uncertainty, and selecting appropriate interpretation methods.
Confidence Metrics: Quantifying Uncertainty & Supporting Decisions
To improve explainability and acceptance, we evaluated methods for local model interpretation. SHAP (SHapley Additive exPlanations) proved particularly suitable. Using Tree SHAP for ensemble models, we achieved a good balance between explanation quality and performance. Under certain conditions, for instance, the 30-day moving average could be identified as the dominant factor.
Confidence metrics quantified the uncertainty of model predictions without affecting system performance. These were based on confidence intervals and probability distributions. A forecast of +10% with an actual increase of only 5% was flagged as uncertain.
Heatmaps visualized these metrics: color-coded displays highlighted critical data points, making uncertainty immediately visible. Business departments could respond in a targeted way to risk-prone predictions.
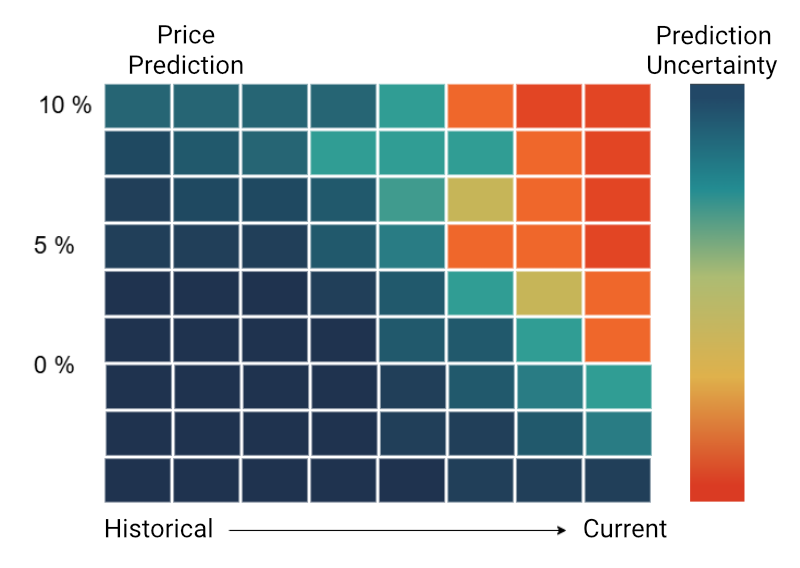
Figure 1: Heatmap
Monitoring System: Supervision and Anomaly Detection
A multi-stage monitoring system ensured the reliability and functionality of the model in live operation:
- Drift detection: Identifying data shifts (e.g., due to interest rate changes or political events)
- Performance monitoring: Assessing metrics such as accuracy, latency, F1 score – dashboard with real-time monitoring
- Error analysis: Collecting and analyzing critical decisions to optimize the model
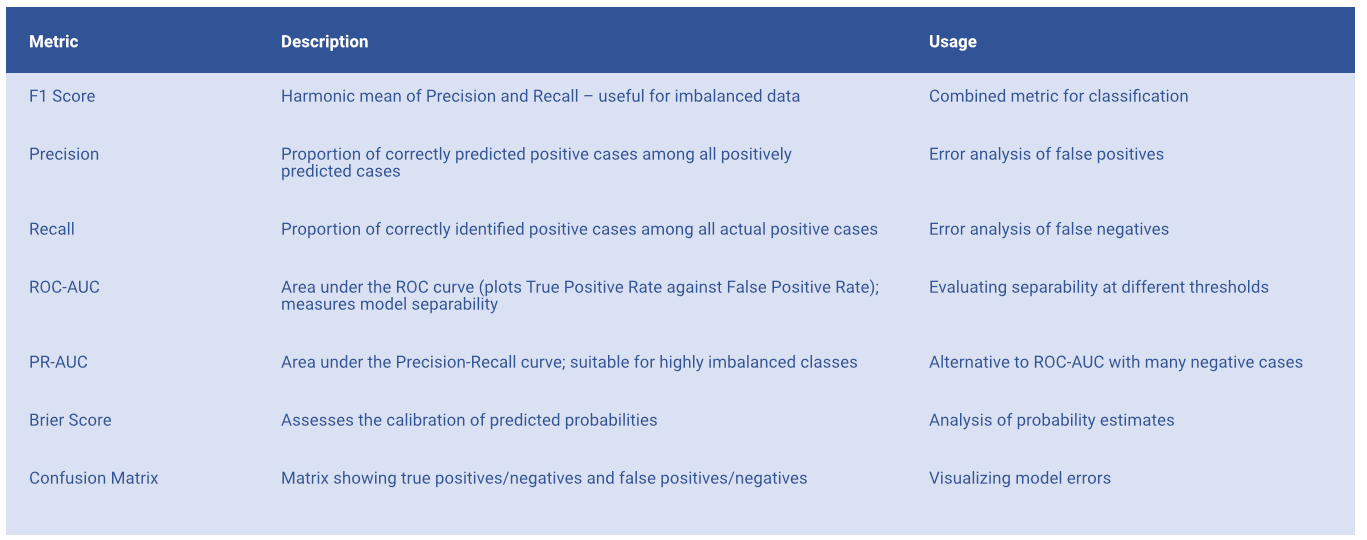
Figure 2: Technical quality metrics
Decisions were considered critical if they significantly deviated from the actual outcome or if the F1 score dropped below 0.75. An analysis tool collected data points to further develop the models in a targeted manner. AUC values and the Brier score were also used for calibration. A confusion matrix supported error classification. In addition, business-relevant metrics such as hit rate for price increases >5%, expected profit per trade, Sharpe ratio, and maximum drawdown were incorporated. The combination of technical and economic analysis enabled a well-founded assessment of model quality.

Figure 3: Business-relevant evaluation metrics
Anonymization and Protection of Input Data
Processing sensitive financial data required strict measures. The data pipeline anonymized names and account information and used techniques such as generalization, pseudonymization, and encryption. Differential privacy minimized the risk of re-identification and supported compliance with regulatory requirements.
Technical Implementation: Model Versioning and Fallback Mechanism
An essential component was model versioning: unlike traditional software versioning, we additionally documented training data, hyperparameters, and evaluation metrics. A model registry stored all versions, including associated metadata and hyperparameters. In case of errors, a fallback mechanism with simple, rule-based calculations ensured critical decisions remained protected.
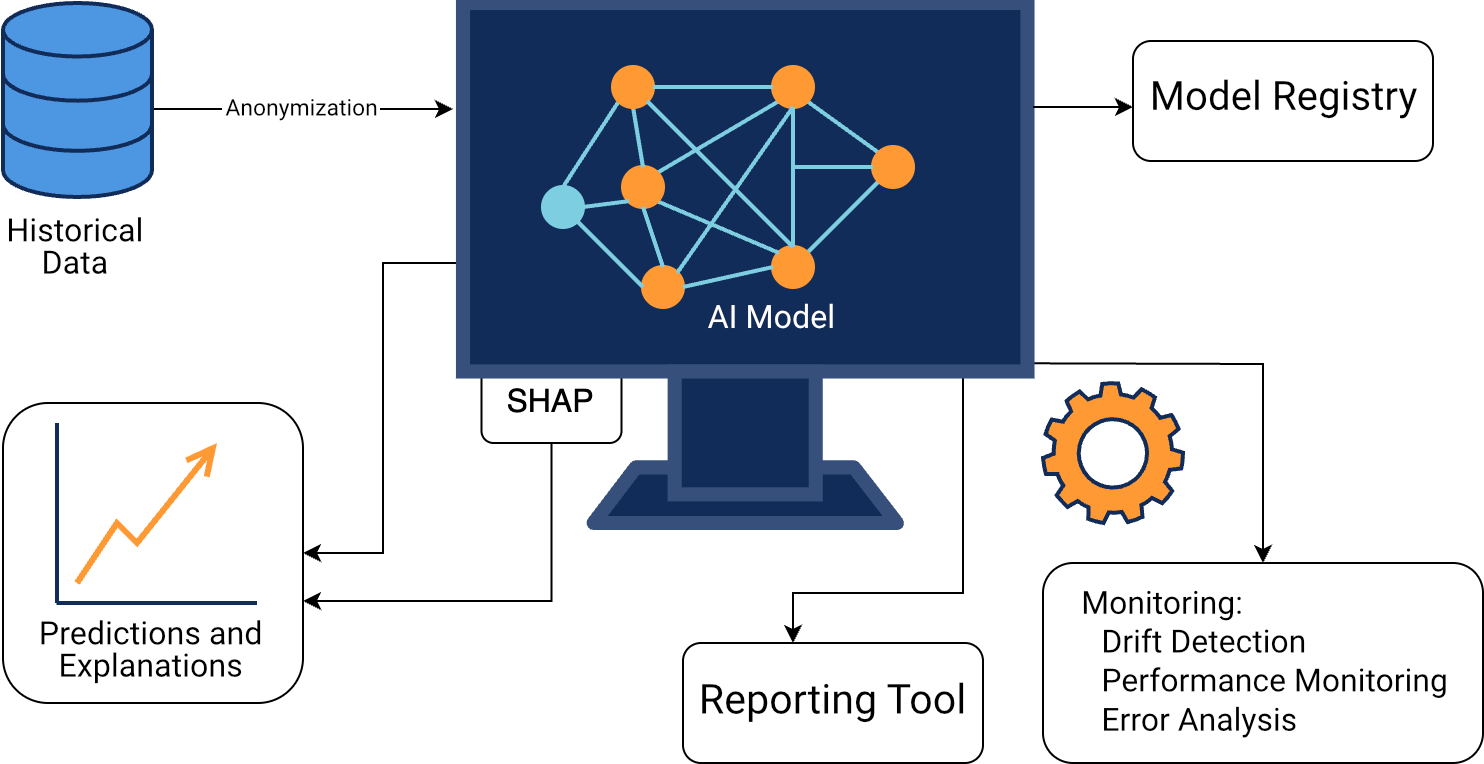
Figure 4: Schematic diagram of technical implementation
Lessons Learned: Architecture as Responsibility
Integrating AI requires foresight, team communication, and discipline. Goal definition, data strategy, and system architecture must be aligned early. Our project showed: data protection, traceability, confidence metrics, and error analyses determine acceptance and reliability. AI is not an end in itself – only in combination with sound architecture, interdisciplinary collaboration, and continuous quality assurance does a robust, responsible system emerge.
AI architecture means: design, explain, safeguard – and continuously adapt.
About the Authors:
Mahbouba Gharbi is Managing Director, software architect, and trainer at ITech Progress GmbH, an iSAQB®-accredited training provider, with more than twenty years of experience. As curator of the iSAQB module SWARC4AI, Mahbouba teaches IT professionals methodological and technical concepts for designing and developing scalable AI systems, with a strong focus on practical and sustainable solutions.
Dimitri Blatner is a software architect and trainer at ITech Progress GmbH. As a certified trainer for SWARC4AI, Dimitri shares practical knowledge on designing and developing scalable AI systems. His focus areas include cloud technologies, DevSecOps, hybrid architectures, and AI solutions. He supports companies in realizing innovative and secure systems.